Scenarios troubleshooting
Debug VoxEngine scenarios with logs and the built-in debugger
This section will help you to troubleshoot VoxEngine scenarios.
Before troubleshooting your scenarios, make sure, that your scenario meets all the requirements specified in the VoxEngine concepts article. In addition, to make your code easier to work with and support, we recommend the following:
- Make sure your code meets the ECMAScript 6 standard. Do not transpile your code below this standard.
- Make the code human-readable, do not minify or obfuscate the code when transpiling and building your app.
- Meet the general JavaScript style guides, for example, Google’s JavaScript style guide.
Built-in Logger
In addition to common JS console.log() you can use the Voximplant’s Logger.write() method to debug your scenarios. The logger saves messages in the JS session logger, which is available via the call history section in the control panel, so you can access your logger messages anytime after you run your application.
Same as with the JS native logger, you can pass objects to the Logger.write() method to analyze them in the call history. Here is an example of how you can use the built-in logger:
Cloud IDE debugger
The debugger is available while you open a scenario in our cloud IDE. To open a scenario, go to the Applications section, click your target application, switch to the Scenarios tab, and click on a scenario. In the upper right corner, you will see the Debug button with a dropdown menu to set debugging parameters before the first run and adjust them as needed.
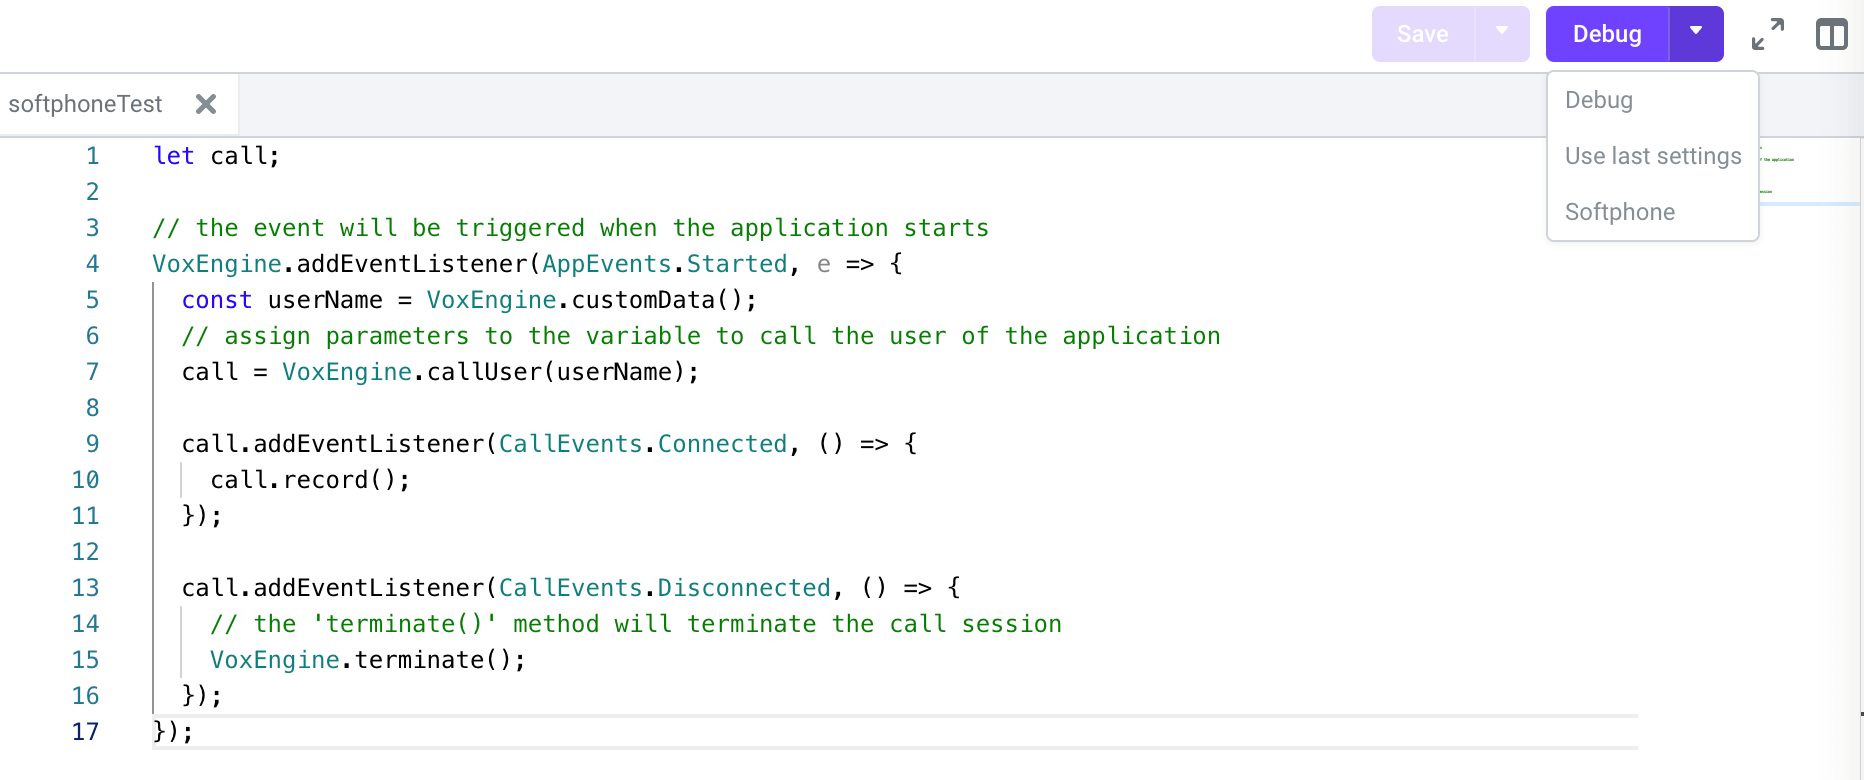
When you click Debug, a Debug parameters dialog appears. If you click Use last settings, the debugger runs immediately.
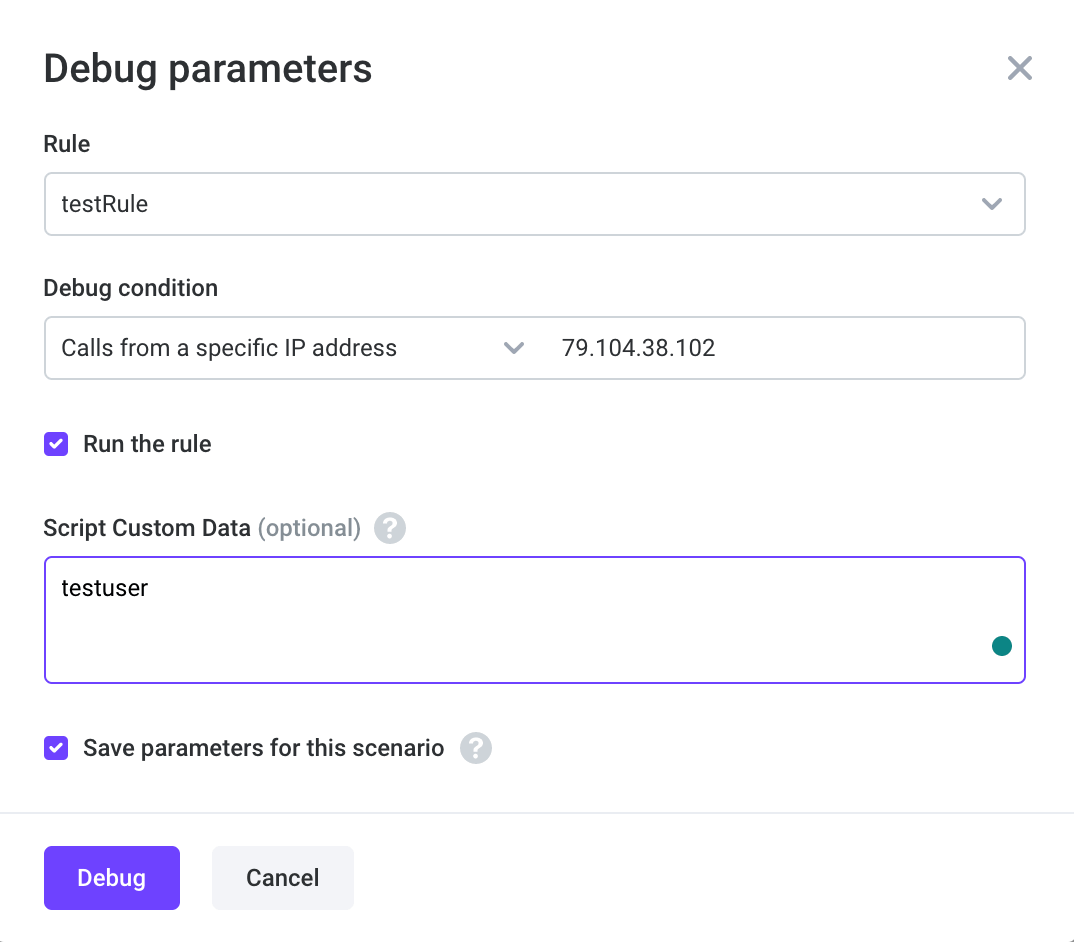
Being in Debug parameters, you should specify the rule for debugging purposes and one of the three debugging criteria, which are available in the dropdown:
- Calls from a specific IP address – the debugger connects to a session started by a call from the specified IP address.
- Calls from a specific phone number – the debugger connects to a session started by a call to/from the specified phone number.
- All calls – the debugger connects to a session started by any call that matches the specified Rule.
After that, you can check the Run the rule checkbox to run your rule along with the debugger. If needed, you can pass custom data to the scenario using the input field below.
The debugger launches after the Debug button click, you can see its interface in the image below:
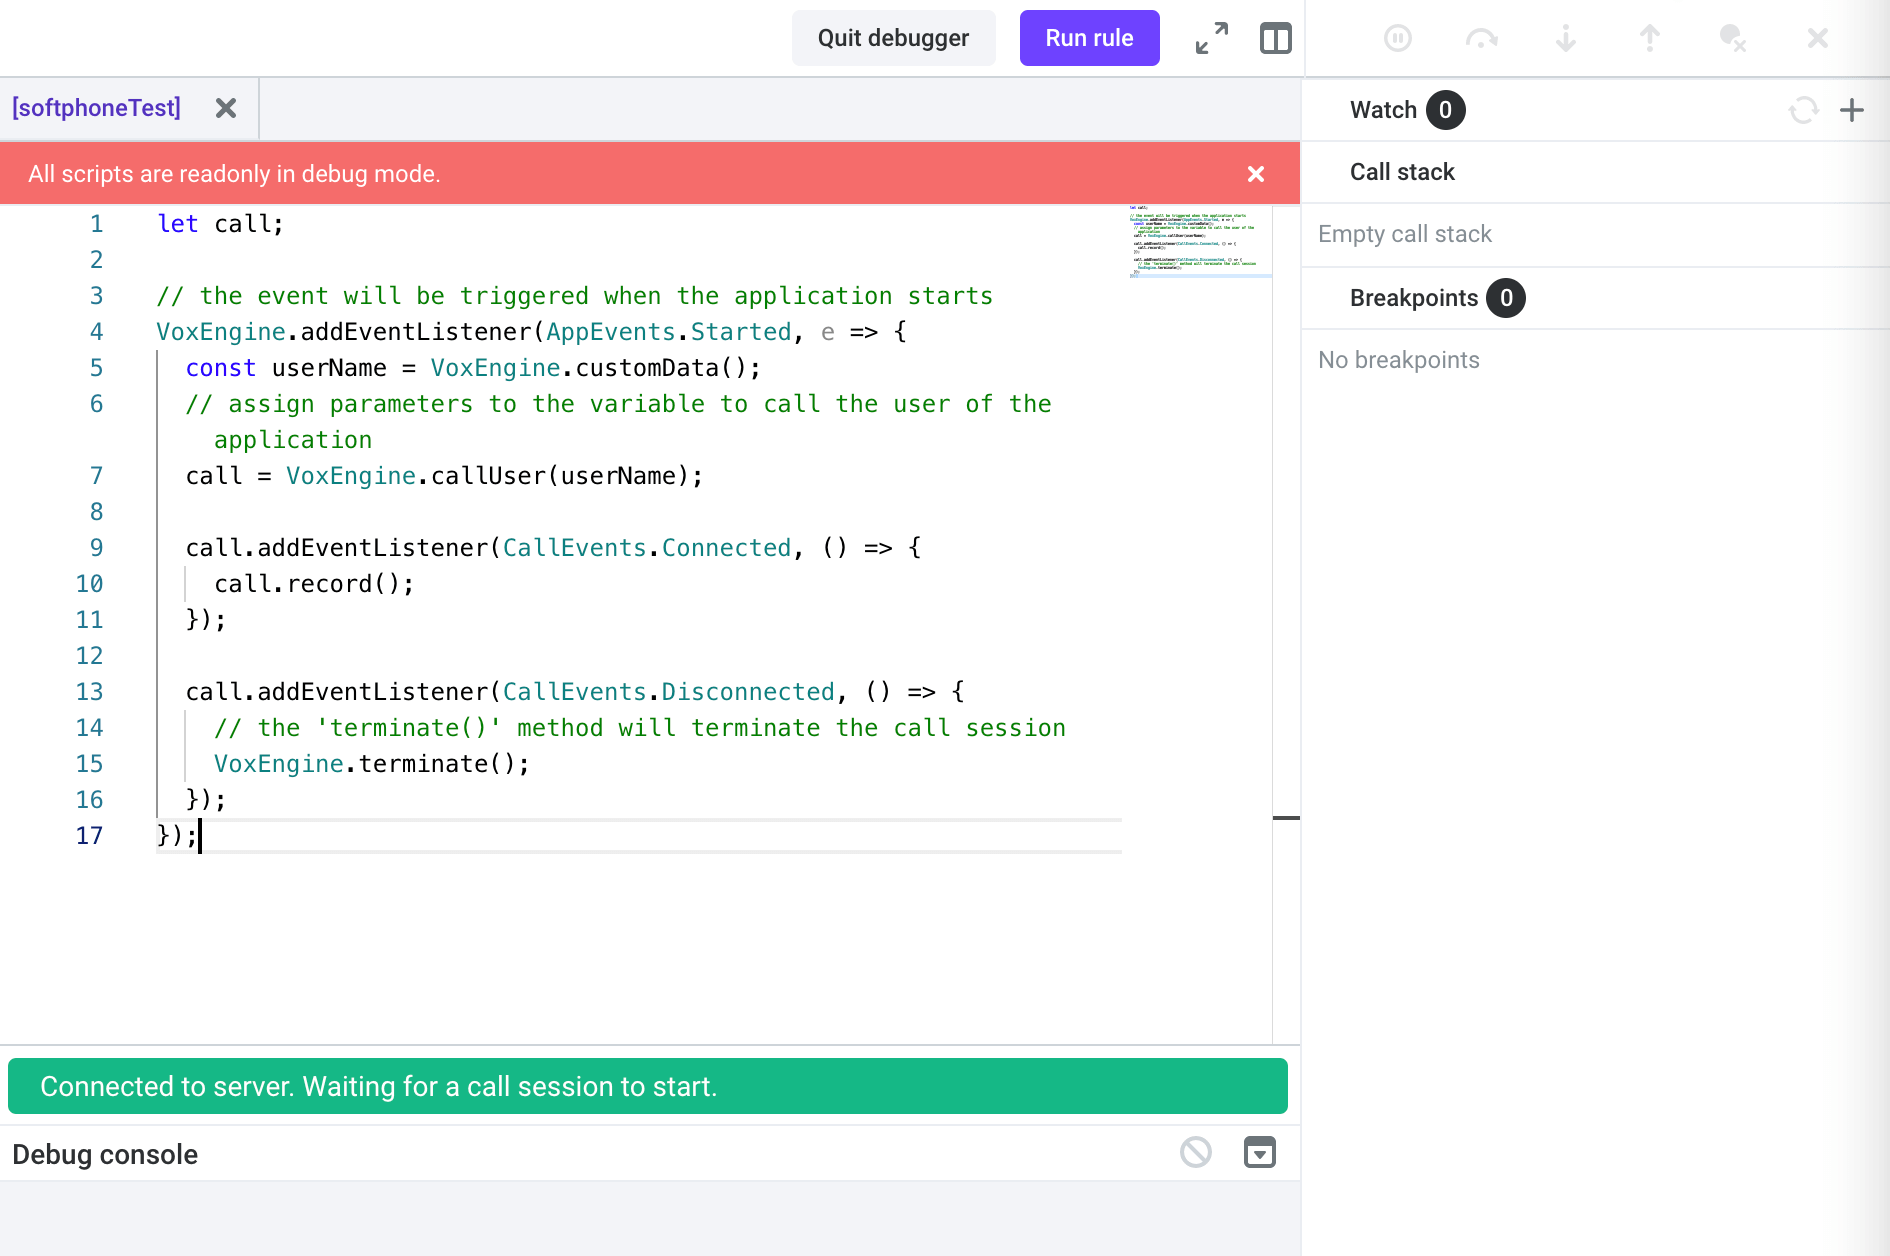
The interface and functionality are very similar to Developer tools (like Firebug) for web browsers that are used to debug JavaScript apps and contain Scripts, Watch Expressions, Call Stack, Breakpoints, and Console sections. The debugger waits for a new session that matches specified parameters (Application, Rule, Criteria) to appear after pressing the ‘START’ button. If you specify some breakpoint, script execution is paused at the line with the breakpoint, and you can use Controls for step-by-step debugging or resuming execution.
Softphone
In the Debug dropdown menu you can also find our Softphone. It is developed with the Voximplant Web SDK. Use this softphone to make and receive calls when testing your app.
Follow the steps below:
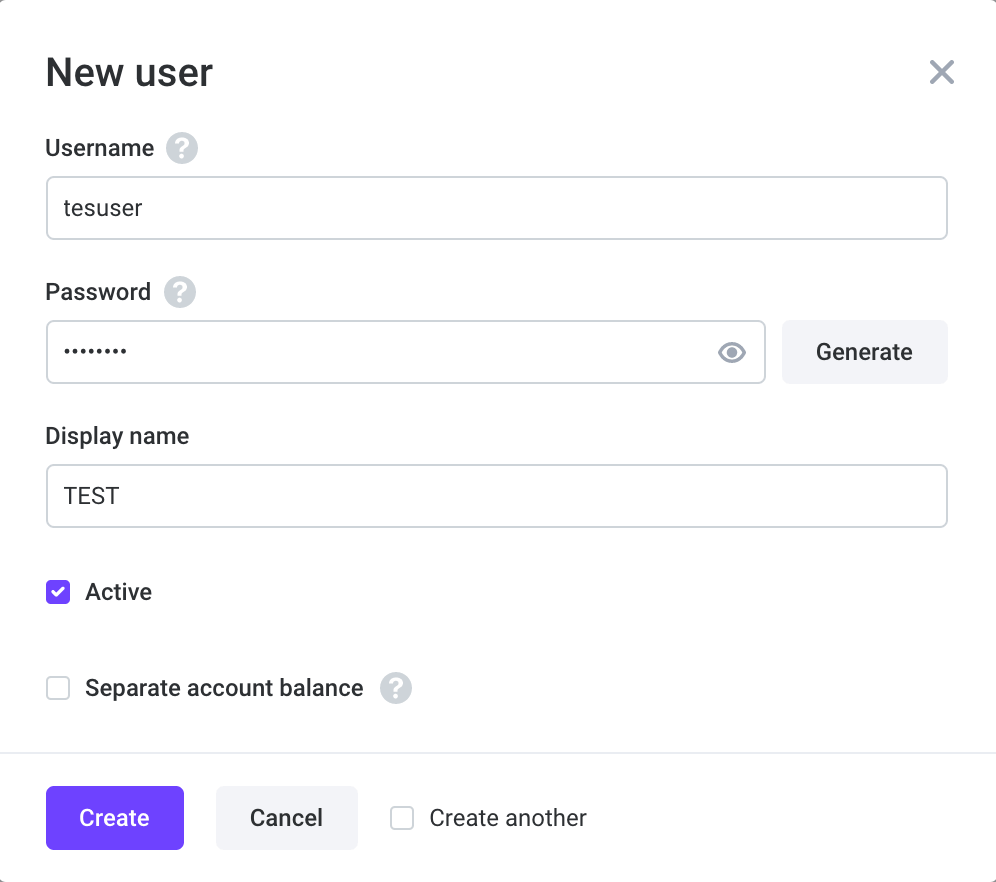
- Create a user in your Voximplant application and remember its credentials:
- Open your scenario and in the upper right corner, click Debug → Softphone.
- Accept the microphone permission if needed.
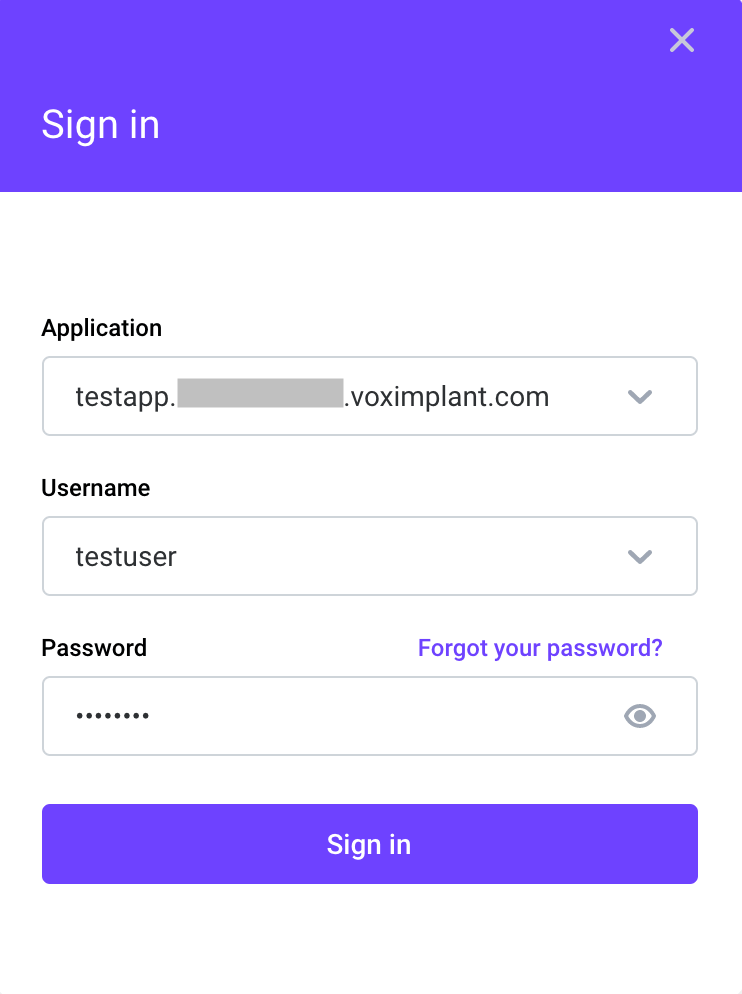
- Log in to the softphone with the created user’s credentials:
- The Debug parameters window will open. Check that everything is set up correctly, specify the username in the Custom data to call if needed.
- Click Debug and receive a call in the browser via the softphone or make one using the dial pad.
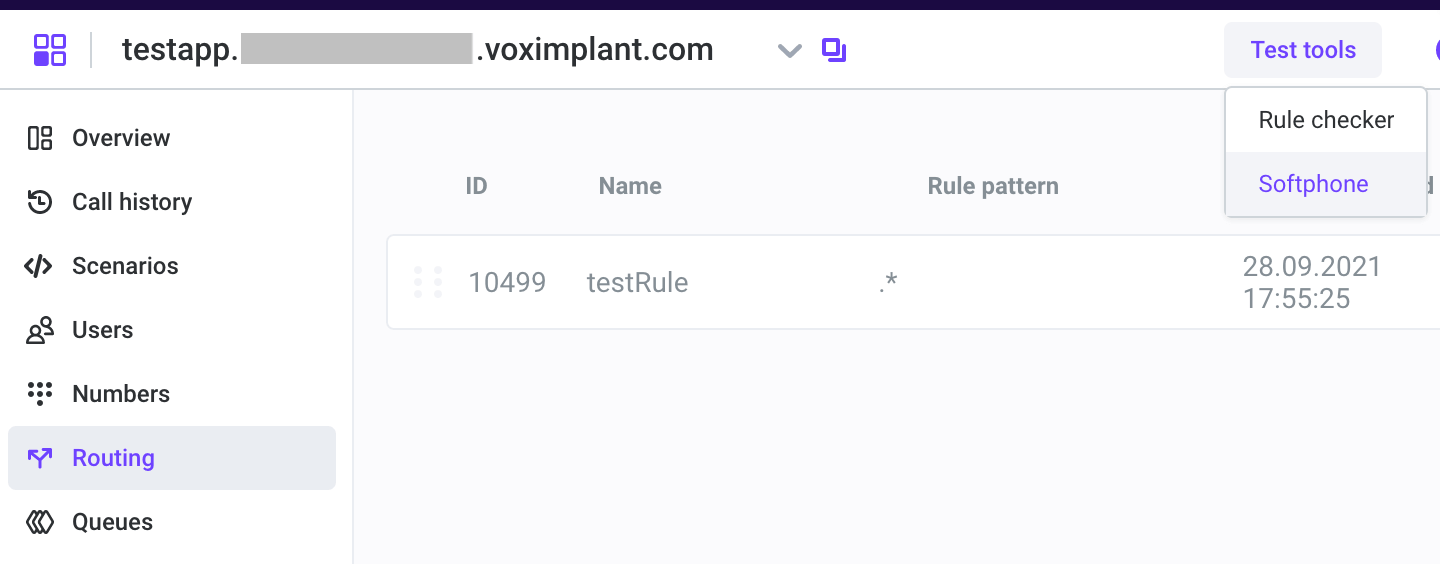
You can also launch the softphone from Test tools in the Routing tab:
Debug keyword
The debugger recognizes the debugger keyword in scenarios so you can use it as in regular JS development.
Note that a JavaScript scenario can output into the Debug Console via the trace() function: